Nashville Autonomous Recording + BirdNET Project
(In revision)
Authors:
Abigail Searfoss, Emily Hudson, Nyssa Kantorek, Tara Stanley, Nicole Creanza
This project (in progress) aims to examine the effects of various metrics of urbanization on bird song, broadly, in urban greenspace. Recorders were placed at 21 parks of varying size and proximity to urban environments throughout Nashville. In total, we collected almost 2800 hours of recordings over the course of 155 days.
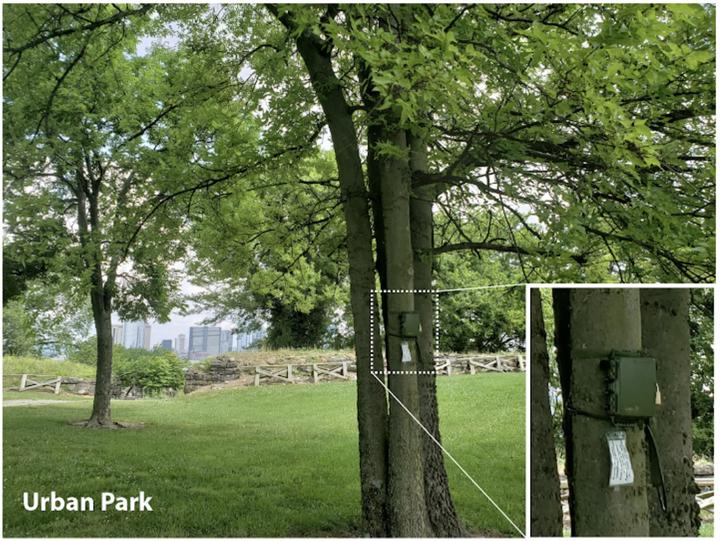
Using a map of artificial night sky brightness as a proxy for degree of urbanization, we identified multiple locations to record (Fig. 1), covering the spectrum between rural and urban (Bortle class 4-9). While the primary focus was on Davidson County in the context of Nashville’s current population growth, locations of field work extend from Davidson County into surrounding counties (Henderson, Wilson, Dekalb, and Maury) for rural collection sites. Throughout the spring and summer of 2018 (March–August), two Wildlife Acoustics SM4 recorders were set to passively record at different parks, moving locations approximately every 1–2 weeks.
The urban variables used were pulled from the Nashville Data Portal: number of Noise Complaints, the number of Building Permits Issued from 2018 to October 2020, and the location of major roads including busy, multiple-lane roads and local highways. Data points in other cities and counties were excluded from this analysis due to GIS data accessibility. We then performed spatial joins in QGIS to record both the number of noise complaints, building permits, major roads, and highways within that buffer region and the distance from the recording locations to each of the nearest urban variables.
After the recordings were collected, as an initial step, we used BirdNET API to identify common species. Because of the nature of unsupervised annotation of autonomous recordings, this first pass of song identification gives us a crude approximation of abundance; one individual singing frequently is not distinguished from many individuals singing infrequently. Nonetheless, the amount of bird song heard from each species does give important information about the ecological community in each park.
How do measures of anthropogenic disturbance affect the species community of bird song?
## Analysis of Deviance Table
##
## Model: Y_mv_binom ~ .
##
## Multivariate test:
##                                   Res.Df Df.diff    Dev Pr(>Dev)
## (Intercept)                           21
## recording_length_h                    20       1  74.69    0.047 *
## world_atlas_2015_bortle_class         19       1 179.56    0.001 ***
## viirs_2018_radiance_10_9w_cm_2_sr     18       1  79.30    0.057 .
## average_foreground_d_b                17       1  25.57    0.947
## average_background_d_b                16       1  75.71    0.129
## rms_difference                        15       1  61.38    0.221
## nearby_noise_complaints               14       1  76.87    0.023 *
## nearby_building_permits               13       1  74.54    0.140
## nearby_major_roads                    12       1  90.13    0.041 *
## area_acres                            11       1  74.56    0.099 .
## ---
## Signif. codes:  0 '***' 0.001 '**' 0.01 '*' 0.05 '.' 0.1 ' ' 1
## Arguments:
##  Test statistics calculated assuming uncorrelated response (for faster computation)
##  P-value calculated using 999 iterations via PIT-trap resampling.
Looking at the whole community of species, light pollution levels (Bortle Scale), nearby major roads, and number of nearby noise complaints have the strongest effect on species composition.

Figure 1. Locations and levels of light pollution of recording sites in and around Nashville, TN. The top image includes locations of all field sites. The inset provides a closer look at the locations around metro Nashville. The maps are adapted from lightpollutionmap.info. The data displayed is the World Atlas 2015 of artificial night sky brightness
–
However, none of the variables have a significant effect on individual species recording abundance when they are each run in a separate univariate test.
## Loading required package: permuteWe can still look at the directional effects of the the significant predictors on species abundance, even if they aren’t significant in univariate tests.
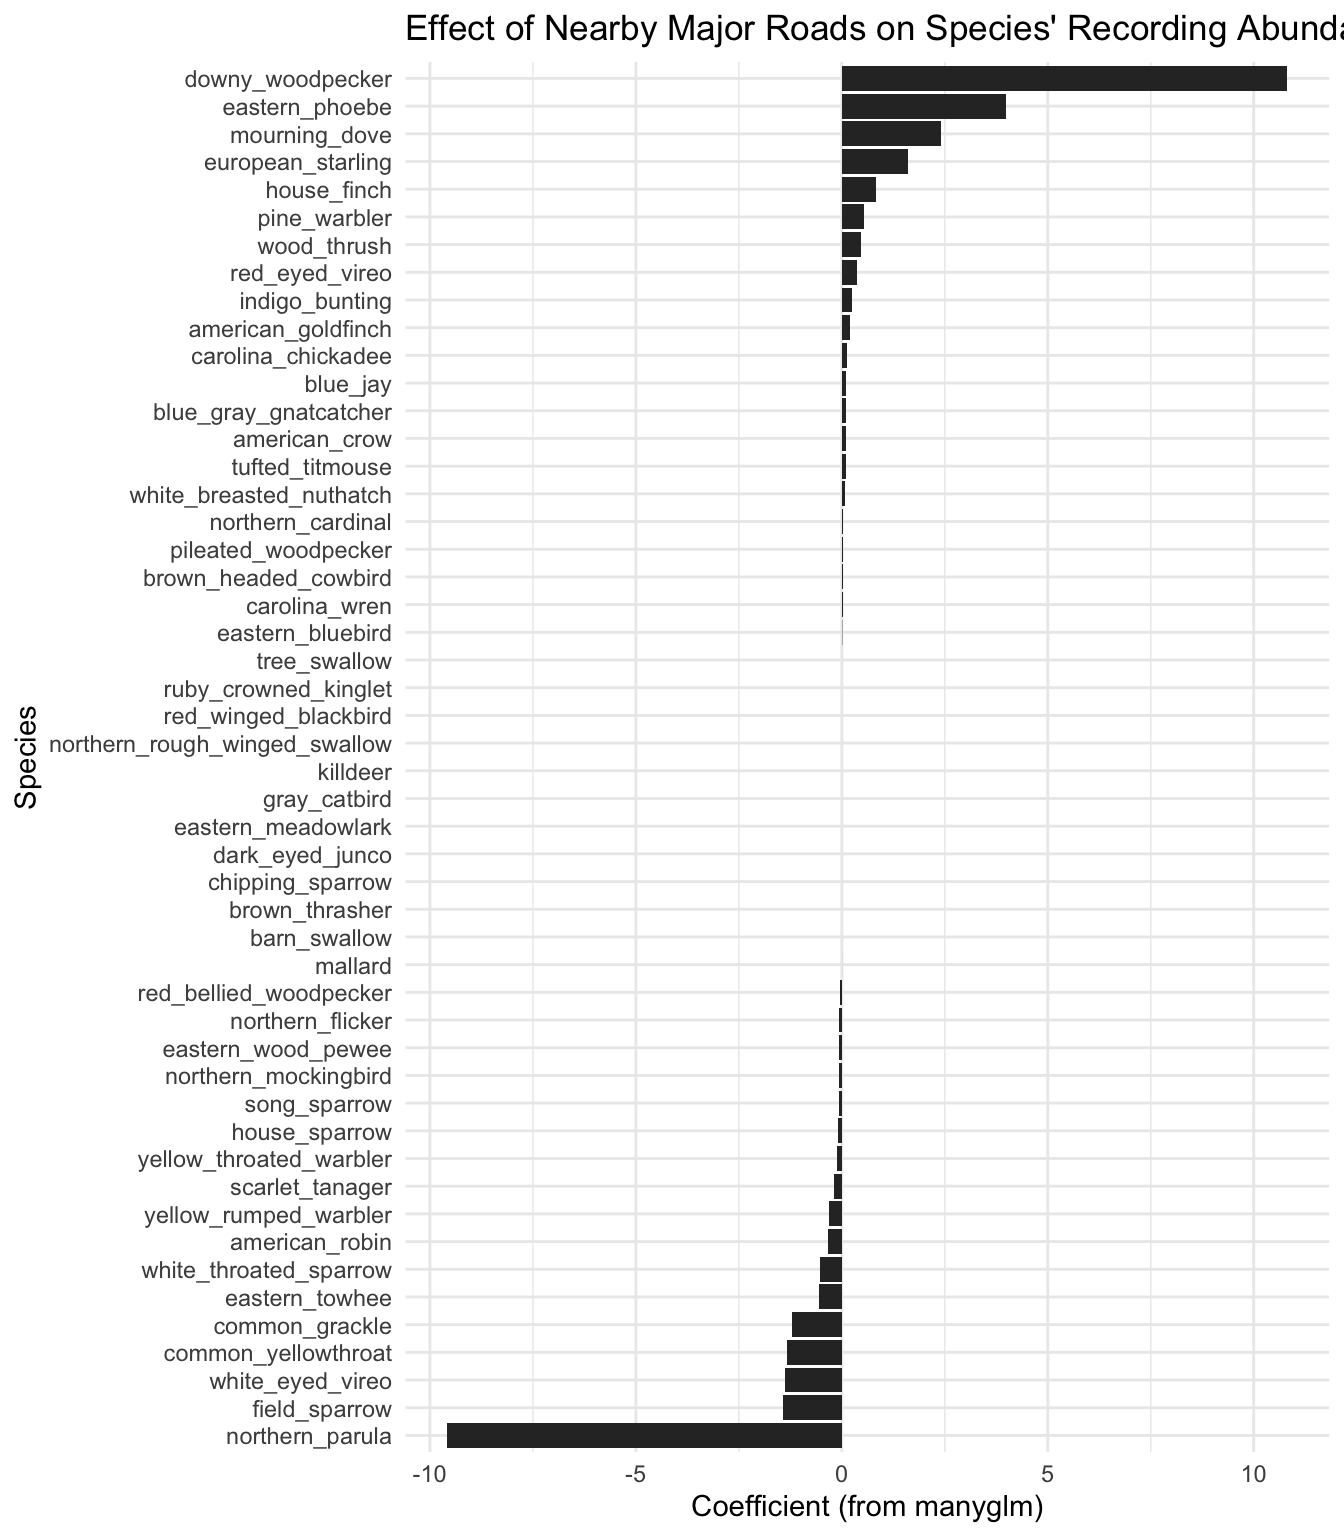
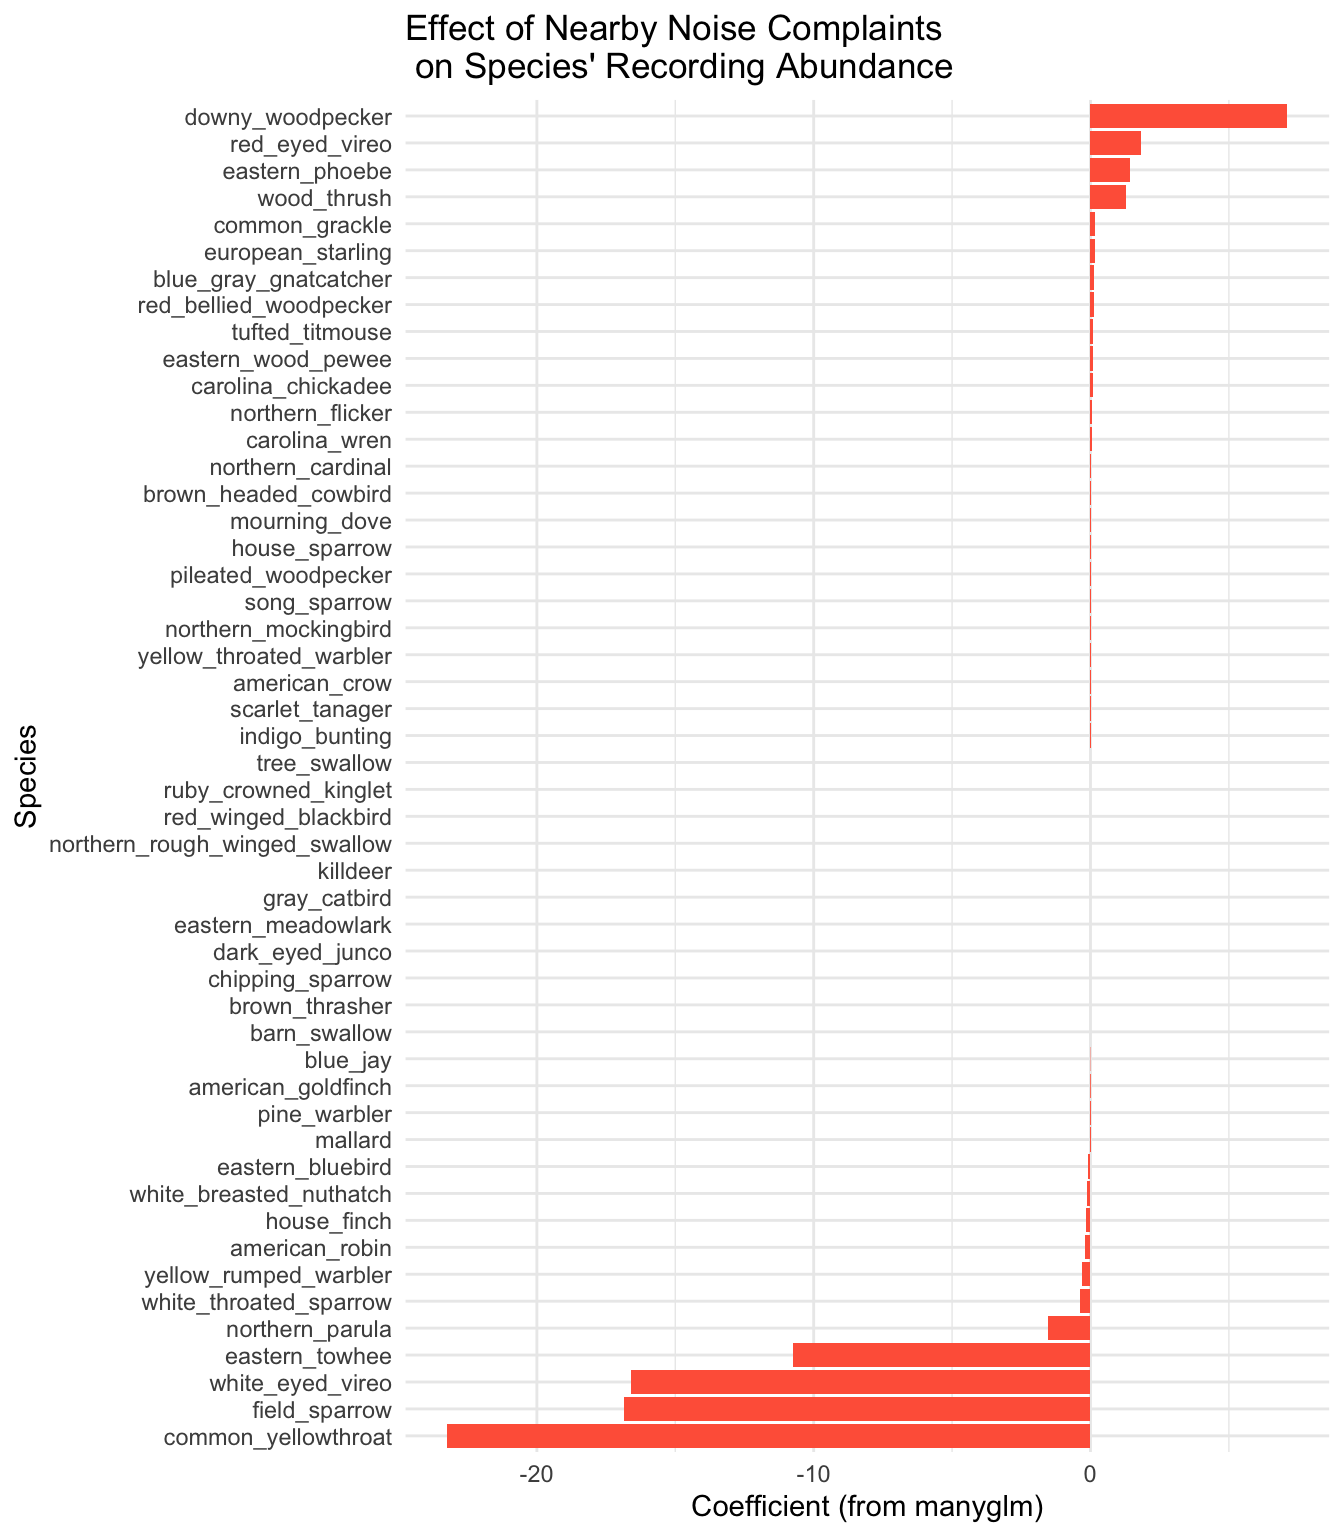
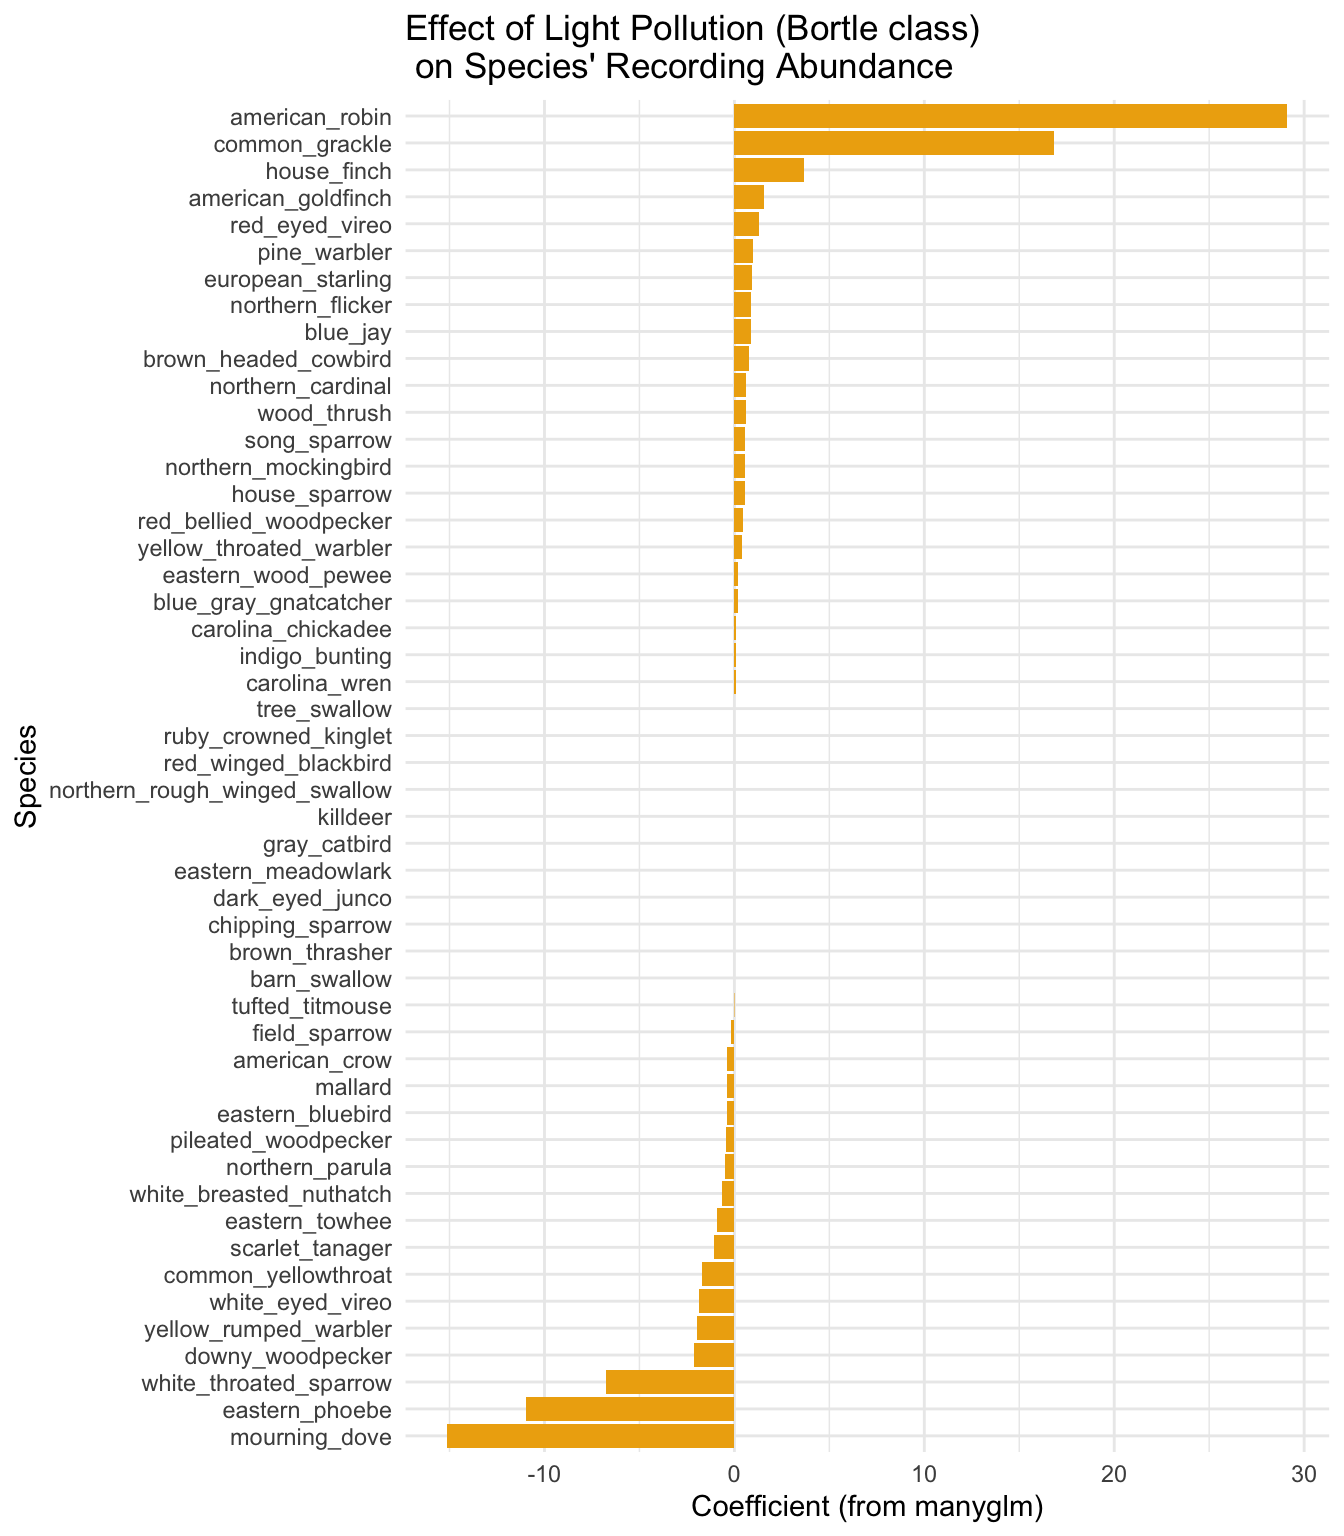
Fig 2. The coefficients from the three significant predictors (road proximity, noise complaints and light pollution) identified by the full generalized linear model. Species-level effects are shown, although none of these effects were identified as significant in post-hoc univariate tests.
A more sophisticated analysis would involve actually estimating abundance (counting individuals); the latest AI models being applied to bioacoustics have this capability. This is a future aim of this project.